OVERVIEW Palatants are flavor enhancers used in pet foods to improve their palatability and increase pet acceptance. Developing an effective palatant involves a systematic approach to selecting the best combination of ingredients that provide the optimal aroma and taste for cats and dogs. However, some ingredients have inherent natural variability...

The Importance of p-value in Palatability Assessments
In the pet food industry, business decisions about product advancement are based on comparative palatability assessments using data. Pet preferences are most often determined using two-bowl trials. Data from these or any comparisons must be carefully analyzed to tell an accurate story. The first step in this analysis is to define what measure you will use for preference. The next step is to determine the p-value, a statistic that indicates whether a hypothetical situation seems reasonable after collecting and analyzing the data.
METHOD
At AFB, the most common method for pet food product preferences is a paired preference trial. Equal amounts of the two foods to be compared are presented simultaneously to each cat or dog. After a preset amount of time or amount eaten, the foods are removed and weighed to determine how much remains. The same two foods are presented the next day in the same manner, except the food positions are switched left to right. This switch is important in order to avoid what is known as “side bias.” Side bias occurs when an animal demonstrates a preference because of its position left/right rather than its flavor. It is vital, statistically, that the two days data are combined and not treated individually. The two days must be considered as one trial in the statistical analysis.
HOW TO CHOOSE A SAMPLE SIZE
The sample size is the number of cats or dogs who are provided the choice in the preference trial. This sample group is meant to be representative of a larger group. In this example, the sample is the dogs used for preference trials, and represents the larger group of dogs in homes who may be interested in this product. With a larger sample size there is increased confidence in the results. There are several ways to set a sample size:
Determining the level of confidence needed: With a larger sample size there is increased confidence in the results. This is dependent on how small a difference you need to find. It is easier to find a difference between 2 grams and 20 grams of food eaten than it is between 2 grams and 4 grams.
Through experience: In the case of pet food preference testing, the industry standard is 20-30 cats or dogs.
Power Analysis: Power analysis is a calculation that can be done on a proposed experiment that helps minimize the chances of coming to the wrong conclusions after statistical testing. Power analysis does require some estimates of parameters to begin with and will change depending on the statistical methods.
Measure
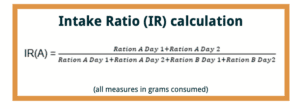
Intake Ratio (IR) is the measure most often used at AFB to draw conclusions about food preferences.
An IR(A) of 0.5 indicates no preference, while an IR(A) of 1 indicates a total preference for Ration A, and an IR(A) of 0 indicates a total preference for Ration B. Most tests
fall within the range of IR(A) = 0.3 to 0.7. Intake ratio compensates for different body sizes and different appetites among the animals in a trial.

Other Measures
AFB also includes measures like consumption ratio and first choice in our palatability reports. These measures can help provide more information on how the cat or dog behaved during the meal. We do not provide a statistical test for these for several reasons.
Intake Ratio (IR) calculation
(all measures in grams consumed)
HOW TO INTERPRET A P-VALUE
In pet food research, when comparing two rations with a statistical test:
- A large p-value means the experiment did not provide compelling evidence the two rations were different inpreference in the pet population.
- A small p-value means enough evidence exists supporting the idea that the two rations are different. In this way, asmall p-value demonstrates we would be unlikely to observe such a large difference between the two rations if, in fact,they are equally preferred in the pet population.
- The historically accepted 0.05 “cutoff” means p-values less than 0.05 are considered statistically significant. This cutoffis based on tradition and was originally influenced by computational convenience before computers became widely available.
EXAMPLES

Significant Difference – results of a trial causes us to conclude that the two foods tested are significantly different.
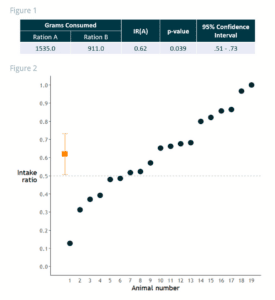
Figure 1 is an example of our standard report for paired preference trials.
Figure 2 shows the results by dog. The IR(A) is 0.62 (Figure 1) and is representated by the orange square. The lines extending from the orange square are the 95% Confidence Interval (0.51-0.73), which is a measure of our confidence in the results. The p-value is 0.039, which indicates that we are unlikely to see this pattern due to chance.
No Significant Difference – results of a trial that does not allow us to conclude that the two foods tested are significantly different.
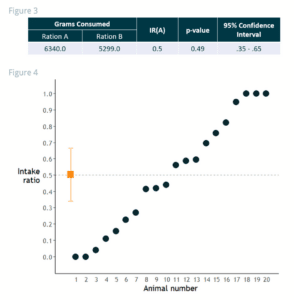
The IR(A) is 0.50 (Figure 3) and is represented by the orange square on Figure 4. The lines extending from the orange square are the 95% Confidence Interval (0.35-0.65), which is a measure of our confidence in the results. The p-value for the two-sided one-sample t-test is 0.49, which indicates that this pattern is not distinguishable from chance.
UNDERSTANDING P-VALUES
The p-value is complicated. Confusion—and even an incorrect conclusion—can arise when the p-value is oversimplified.
For example, one common claim is that a p-value that falls above the 0.05 cutoff indicates the two rations were the same in preference. In fact, it merely indicates there was not enough evidence in the data to conclude the rations were different. The situation is similar to a group of biologists who are studying a lake. They think the lake has fish in it, so they cast a net into the water. 
Furthermore, the p-value doesn’t tell the whole story. Consider the second example (Figure 4): Dogs in this pet food trial have high variation, with some showing high preference for one ration and some preferring the other ration. This resulted in a large p-value, indicating no significant difference between rations.
However, rather than dismiss the results, it would be wise to further investigate whether there was an identifiable characteristic potentially responsible for the preferences—such as older dogs preferring one ration and younger dogs preferring the other. Finding that characteristic could help pet food manufacturers develop a strategy to target different consumer segments for that particular ration, despite no statistically significant difference between rations. The result could make maximum use of the research data and provide new opportunities to serve pet owners more effectively.